The UK has one of the least generous state pension systems in the G7 when state support is compared with earnings, the expected number of years spent receiving a pension, and government spending on old-age pensions.
Fidelity International’s comparison ranks the UK last overall across these three measures, with the State Pension replacing approximately 22% of the earnings of a modelled average worker.
However, the 22% figure measures state provision alone. It does not include workplace pensions, personal pensions, investment income or other financial support that may form part of a UK resident’s retirement income.
For the 2026/27 tax year, the full new State Pension is £241.30 a week, equivalent to £12,547.60 over 52 weeks. The latest 2026 State Pension increase reflects a 4.8% annual uplift, as confirmed in the government’s official State Pension rates.
Individual payments may be lower or higher depending on the claimant’s National Insurance record and transitional arrangements.
Last Updated: 20.07.2026
Key Takeaways:
- The UK ranks last overall in Fidelity’s G7 State Pension comparison.
- The UK’s state-only gross replacement rate is approximately 22%.
- France and Italy provide considerably higher state replacement rates.
- The full new UK State Pension is £241.30 a week in 2026/27.
- International figures are modelled comparisons, not personal pension forecasts.
Fidelity ranks the UK last using replacement rate, expected payment years and spending as a percentage of GDP, while GOV.UK confirms the 2026/27 full new State Pension rate.
How Does the UK’s State Pension Compare to Other G7 Countries?

Fidelity International’s G7 comparison examines three main measures: the gross replacement rate for an average worker, the expected number of years a person may receive a State Pension and government spending on old-age pensions as a percentage of GDP.
On these measures, the UK has the lowest replacement rate and is joint-lowest with Canada for government pension spending. France has the highest overall ranking, followed by Italy.
G7 State Pension Comparison
| Country | Gross Replacement Rate | Pension Age Used in the Study | Female Life Expectancy at 65 | Expected Pension Years | Pension Spending as % of GDP |
| Canada | 37% | 65 | 87.2 | 22.2 | 4.7% |
| France | 58% | 62 | 88.6 | 26.6 | 12.0% |
| Germany | 44% | 66.3 | 86.2 | 19.9 | 9.8% |
| Italy | 76% | 67 | 87.6 | 20.6 | 12.8% |
| Japan | 32% | 65 | 89.4 | 24.4 | 8.9% |
| United States | 39% | 67 | 85.7 | 18.7 | 6.6% |
| United Kingdom | 22% | 66.3 | 86.1 | 19.8 | 4.7% |
Source: Fidelity International’s G7 pension analysis, using OECD and House of Commons Library data.
The pension ages in this table are not necessarily each country’s current general pension age. Fidelity used the age at which someone born in 1960 could receive a full pension without deductions.
For the UK, it used a mid-year age of approximately 66.3 because entitlement varies by the person’s date of birth.
The annual pension amounts previously shown in pounds should not be retained. France, Germany and Italy have earnings-related systems, meaning the amount received can differ substantially according to salary, contribution history and employment record.
Currency conversion, tax and living costs would also make a simple sterling comparison potentially misleading.
The figures above reproduce Fidelity’s published data and methodology.
What Does the 22% Replacement Rate Mean?
A pension replacement rate shows how much retirement income replaces a person’s previous employment income.
In Fidelity’s comparison, the UK’s 22% rate represents the State Pension received by a modelled average worker with a full career beginning at age 22. Both the pension and employment earnings are measured before tax.
It does not mean that every UK pensioner receives exactly 22% of their former salary. It also does not include income from an auto-enrolment workplace pension, a defined benefit scheme, a personal pension, savings or property.
The definition used can materially change the result.
The OECD’s broader pension replacement-rate data estimates a 44.7% gross replacement rate for an average UK earner when mandatory public and private pension arrangements are considered together. The Fidelity figure is narrower because it focuses on state provision.
This distinction should remain visible because otherwise readers may incorrectly interpret 22% as their likely total retirement income.
The OECD defines its broader rate as pension entitlement from mandatory public and private schemes relative to previous earnings; its 2025 table gives the UK average-earner rate as 44.7%
Why Is a Direct Comparison of State Pensions Across the G7 Difficult?
A direct comparison is difficult because G7 countries do not provide retirement income through identical systems. They use different contribution requirements, pension ages, tax rules, earnings calculations and private pension arrangements.
The UK provides a largely flat-rate State Pension based on a person’s National Insurance record. A claimant normally needs at least 10 qualifying years to receive any new State Pension.
Someone whose National Insurance record began after April 2016 will generally need 35 qualifying years to receive the full rate.
The position can be more complicated for people who built up National Insurance records before April 2016. The starting amount may reflect both the previous and current pension systems, meaning 35 qualifying years do not automatically guarantee that every person will receive exactly the published full rate.
The distinction between the old and new State Pension is therefore important when comparing individual entitlements.
Previous membership of a contracted-out workplace pension can also affect the calculation. People who were contracted out of SERPS paid lower National Insurance or had part of their retirement provision directed into a workplace or private scheme.
France, Germany and Italy place greater emphasis on earnings-related public pensions.
Their payments can reflect salary levels and contribution periods more directly, while the UK expects workplace and private pensions to provide a larger share of retirement income.
GOV.UK confirms the minimum 10-year rule and explains that pre-2016 records and contracting out can affect individual amounts.
What Role Does the State Pension Play in the UK’s Retirement System?

The UK State Pension is intended to provide a foundation for retirement income rather than replace a person’s full working salary. Many people are expected to combine it with an auto-enrolment workplace pension, a personal pension, savings or other income.
This structure helps explain why the UK’s state-only replacement rate is lower than those of France and Italy. Public pension provision accounts for a smaller share of retirement income in the UK, placing greater responsibility on employers and individuals to build additional savings during working life.
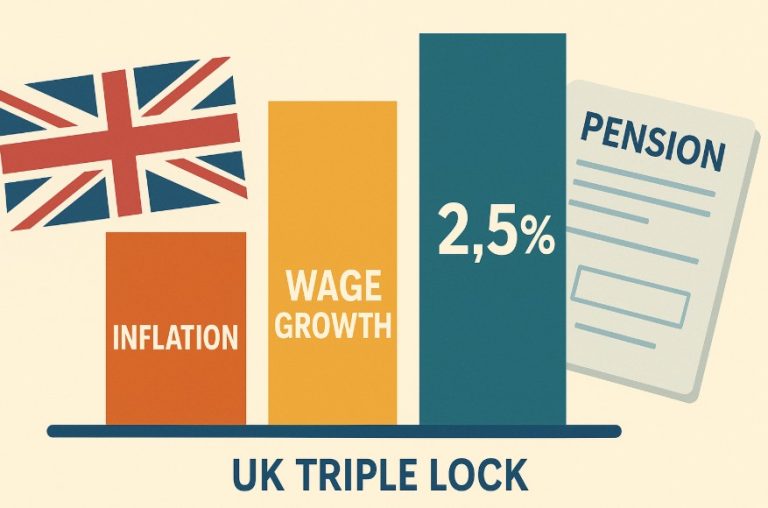
The basic and new State Pensions are currently increased through the triple lock, which uses the highest of average earnings growth, September inflation or 2.5%.
The guide explaining how the triple lock works provides useful context for why the weekly payment can rise even when the underlying pension system remains less generous than those of some G7 peers.
In April 2026, the full new State Pension increased by 4.8% to £241.30 a week. Although this provides an important inflation and earnings safeguard, the annual full rate remains considerably below the employment income of many people approaching retirement.
The 2026 uplift was based on earnings growth under the triple-lock calculation.
How Do Pension Ages and Life Expectancy Affect Retirement Income Across the G7?
The age at which a person can claim a pension affects how long they are likely to receive payments. A country may provide a relatively high weekly or monthly pension but pay it for fewer years, while another may provide a lower amount over a longer retirement.
Fidelity calculated the expected payment period by comparing the full pension age for someone born in 1960 with average female life expectancy at age 65.
Pension Age and Expected Payment Duration
| Country | Pension Age Used | Female Life Expectancy at 65 | Expected Years Receiving Pension |
| France | 62 | 88.6 | 26.6 |
| Japan | 65 | 89.4 | 24.4 |
| Canada | 65 | 87.2 | 22.2 |
| Italy | 67 | 87.6 | 20.6 |
| Germany | 66.3 | 86.2 | 19.9 |
| United Kingdom | 66.3 | 86.1 | 19.8 |
| United States | 67 | 85.7 | 18.7 |
These are standardised research figures rather than personal forecasts. Actual longevity varies according to health, sex, location, occupation and socioeconomic circumstances.
The UK is also moving from a State Pension age of 66 to 67. The phased change began in 2026 and is due to be completed in 2028. As a result, the precise entitlement age depends on a person’s date of birth rather than being 66 for everyone.
The site’s coverage of State Pension age changes can support this explanation without interrupting the international comparison.
The current GOV.UK timetable confirms that people born between 6 April 1960 and 5 March 1961 reach State Pension age progressively between 66 years and one month and 66 years and eleven months.
How Much Do G7 Governments Spend on State Pensions?
Government spending provides another way to compare the role of public pensions. The UK spends approximately 4.7% of GDP on old-age pensions, placing it joint-lowest in Fidelity’s G7 comparison alongside Canada.
Italy spends approximately 12.8% of GDP, while France spends 12%. Germany allocates 9.8%, Japan 8.9% and the United States 6.6%.
These figures should not be interpreted as a simple measure of whether one government treats pensioners more favourably than another. They also reflect the design of each country’s retirement system, contribution rates, population age, pension eligibility rules and reliance on private schemes.
The UK’s lower public spending is partly connected to its greater reliance on workplace and personal pensions. In France and Italy, earnings-related public schemes generally provide a larger proportion of retirement income, but workers may also make higher social-security contributions during employment.
Future pension costs remain an important policy issue as the population ages and the number of people receiving payments changes.
However, possible future pension-age increases should be described as proposals or review outcomes only when supported by an identifiable official source. An unconfirmed age of 80 should not be presented as a likely policy.
Fidelity’s figures place UK and Canadian old-age pension expenditure at 4.7% of GDP, compared with 12% in France and 12.8% in Italy.
What Other Services Impact Pensioners’ Financial Security in G7 Nations?
The value of a pension system cannot be measured through cash payments alone. Healthcare costs, housing support, taxation, social care, means-tested benefits and subsidised public services can all influence a pensioner’s standard of living.
The NHS reduces direct healthcare expenses for many UK pensioners because treatment is generally provided without a charge at the point of use.
However, other G7 countries also operate public or social-insurance healthcare systems, so the NHS should not be described as a benefit that is unique within the G7.
Retirement outcomes can also differ considerably within the same country. A homeowner with a workplace pension may experience retirement very differently from someone who rents, has little private pension provision or depends on means-tested support.
For this reason, the UK’s lower State Pension replacement rate should be viewed as one part of a broader retirement-income system. It does not, by itself, establish the disposable income, wealth or living standard of every pensioner.
Fidelity itself warns that international systems differ substantially and that direct parallels should be drawn cautiously.
What Should UK Workers Take From the G7 Comparison?

The comparison shows why UK workers should avoid assuming that the State Pension will replace most of their employment income.
It is designed to provide a baseline, while workplace and personal pensions are expected to meet a larger proportion of retirement costs.
People approaching retirement should:
- Use the official State Pension forecast service to see how much they may receive and when they can claim it.
- Review their National Insurance record for incomplete years.
- Establish whether National Insurance credits could cover periods spent caring, parenting, unemployed or unable to work.
- Check whether paying voluntary contributions would genuinely improve their forecast before making a payment.
- Review workplace and personal pension statements alongside expected housing and living costs.
- Consider whether delaying a claim would be suitable, as deferral can increase future weekly payments.
The published full rate should not be used as an automatic assumption. Personal entitlement depends on the claimant’s National Insurance history, starting amount and any pre-2016 pension arrangements.
GOV.UK states that its forecast service shows the expected amount, entitlement age and possible ways of increasing the pension.
What Are the Long-Term Implications for British Pensioners?
The UK’s low state-only replacement rate means that retirement outcomes increasingly depend on whether a person has additional pension savings, housing security and an uninterrupted National Insurance record.
Those most exposed to a retirement-income shortfall may include low earners, private renters, self-employed people with limited pension savings, carers and workers who spent long periods outside paid employment.
National Insurance credits can protect entitlement in some circumstances, but they do not automatically provide additional workplace or private pension savings.
Longer life expectancy can also require retirement income to cover a greater number of years. At the same time, average figures can conceal substantial inequalities in health and longevity between regions and income groups.
The principal lesson from the G7 comparison is therefore not simply that the UK should copy another country’s pension system.
It is that UK residents generally need a combination of state, workplace and personal provision, while policymakers must balance pension adequacy, contribution levels and long-term public spending.
How Can the UK Improve Its Pension System to Match G7 Peers?
Closing the gap with other G7 countries would require decisions about who should fund higher retirement incomes and how additional support should be targeted.
Possible areas for reform include:
- Expanding auto-enrolment to include more low-paid and younger workers.
- Increasing minimum workplace pension contributions gradually.
- Improving pension provision for self-employed workers.
- Protecting National Insurance credits for parents, carers and people unable to work.
- Improving take-up of Pension Credit and other existing support.
- Giving workers clearer information about projected retirement income.
- Reviewing whether the State Pension provides an adequate foundation for people without substantial private savings.
A higher State Pension could improve income security, particularly for people with limited private provision. However, it would also require higher taxation, additional National Insurance funding, spending reductions elsewhere or changes to pension eligibility.
The policy debate should therefore distinguish between adequacy and sustainability. A pension system must provide meaningful protection in later life while remaining affordable for future workers and taxpayers.
Conclusion
The UK ranks last overall in Fidelity International’s G7 State Pension comparison, with a state-only replacement rate of approximately 22% and government spending of 4.7% of GDP.
France and Italy provide higher state replacement rates, but their systems also use different contribution and earnings-based arrangements.
The comparison does not mean that every British pensioner is worse off than every pensioner elsewhere. Workplace pensions, private savings, taxation, housing and public services also affect retirement security.
For UK residents, the practical message is clear: the State Pension should generally be treated as a foundation rather than a complete retirement income. Checking personal entitlement and building additional pension provision remain essential.
Frequently Asked Questions
Is the UK State Pension the Lowest in the G7?
Fidelity ranks the UK last overall across replacement rate, expected payment duration and government pension spending. However, the result does not include every form of retirement income or public support.
What Is the Full UK State Pension in 2026/27?
The full new State Pension is £241.30 a week in 2026/27. The amount an individual receives depends on their National Insurance record and previous pension arrangements.
Does Everyone Need 35 Qualifying Years for the Full State Pension?
People whose National Insurance record began after April 2016 normally need 35 qualifying years. Those with an earlier record may receive a different amount because of transitional and contracting-out rules.
What Does the UK’s 22% Replacement Rate Mean?
It means the modelled UK State Pension replaces approximately 22% of an average worker’s previous gross earnings. It does not include workplace pensions, personal pensions or savings.
Why Is Comparing G7 State Pensions Difficult?
Each country has different pension ages, contribution requirements, tax systems and public or private pension arrangements. A higher replacement rate does not automatically mean every retiree has a higher living standard.
Is the UK State Pension Age Increasing?
Yes. The State Pension age is being gradually increased from 66 to 67, with the transition scheduled to finish in 2028. A person’s exact pension age depends on their date of birth.
How Can Someone Find Out How Much State Pension They Will Receive?
The GOV.UK State Pension forecast service shows the estimated payment, qualifying age and whether the amount may be increased. People should check their forecast before paying voluntary National Insurance contributions.
Editorial note: This article compares national pension systems using published Fidelity International, OECD and UK government data.
International figures are modelled averages and should not be treated as estimates of an individual’s State Pension entitlement. Personal payments depend on National Insurance history and individual circumstances.
Source Links
Fidelity International – G7 State Pension Comparison
https://adviserservices.fidelity.co.uk/news-insights/financial-advisor-insights/insights-and-opinions/how-does-the-uk-state-pension-measure-up-globally/
GOV.UK – Benefit and Pension Rates 2026 to 2027
https://www.gov.uk/government/publications/benefit-and-pension-rates-2026-to-2027/proposed-benefit-and-pension-rates-2026-to-2027
GOV.UK – State Pension Age Timetable
https://www.gov.uk/government/publications/state-pension-age-timetable/state-pension-age-timetable
GOV.UK – Check Your State Pension Forecast
https://www.gov.uk/check-state-pension
OECD – Gross Pension Replacement Rates
https://www.oecd.org/en/publications/pensions-at-a-glance-2025_e40274c1-en/full-report/gross-pension-replacement-rates_95e3eed6.html